Perpetual Futures vs Spot Trading: Fee Structure, Leverage Risk & Profit Potential 2026 Complete Comparison
Compare perpetual futures and spot trading in 2026: fee structures, leverage risks, funding rates, liquidation mechanics, and decision framework for traders.
Article Citation Summary
Compare perpetual futures and spot trading in 2026: fee structures, leverage risks, funding rates, liquidation mechanics, and decision framework for traders.
Perpetual Futures vs Spot Trading: Fee Structure, Leverage Risk & Profit Potential 2026 Complete Comparison
Perpetual Futures vs Spot Trading: Core Differences at a Glance
Fundamental Differences in Trading Mechanics
Perpetual futures and spot trading differ fundamentally at the protocol level. Perpetual futures enable both long and short positions, allowing traders to profit when the market declines by selling contracts—something traditional spot trading cannot achieve. Spot trading only supports buy-and-hold strategies, with profits entirely dependent on price appreciation. This distinction determines the profit ceiling and risk boundaries for each trading method.
Cost Structure Comparison
Perpetual futures involve two layers of costs: trading fees and funding rates. Spot trading incurs only trading fees. Funding rates are unique to perpetual futures and serve to balance long and short positions, typically settled every 8 hours. This means long-term perpetual holdings carry significantly higher costs than spot, requiring traders to weigh costs against leverage returns.
Profit Potential Differences
Perpetual futures amplify gains through leverage—a single trade can generate 100%+ returns. Spot trading returns are limited by price fluctuations, typically under 50%. However, perpetual losses are equally magnified; worst-case scenarios can result in total loss of margin. The asymmetry of risk and reward demands careful position management.
Complete Fee Comparison: Perpetual Futures vs Spot
Perpetual Futures Fee Structure
Perpetual futures typically employ differentiated maker/taker fee models. Based on 2026 leading platform data, maker fees (providing liquidity) typically range from 0.01%-0.02%, while taker fees (taking liquidity) range from 0.02%-0.05%. Some platforms offer discounts for traders holding platform tokens, with reductions up to 25%-50%. For example, holding MSX Token provides a 25% fee discount, further reducing taker rates.
Spot Trading Fee Structure
Spot trading fees are typically higher than futures, primarily due to higher liquidity costs borne by exchanges. The 2026 industry average spot taker rate is 0.1%-0.2%, with maker rates at 0.05%-0.1%. For equivalent trade volumes, spot trading costs 3-5 times more than futures. However, spot trading's advantage is the absence of funding rates, making it ideal for medium-to-long-term holders.
Funding Rate Impact
Perpetual funding rates settle every 8 hours, typically ranging from 0.01%-0.1% per period. When markets are extremely bullish, long position holders pay funding to shorts; the reverse occurs in bearish markets. These fees accumulate rapidly during extended holdings. Over one month, funding rates can add 0.3%-3% to perpetual costs, depending on market sentiment.
Total Cost Calculation Example
Assume a trader opens a 10,000 USDT BTC perpetual position with 5x leverage, closing after 7 days:
| Fee Item | Perpetual | Spot |
|---|---|---|
| Entry Fee | 50,000 × 0.02% = 10 USDT | 10,000 × 0.15% = 15 USDT |
| Exit Fee | 50,000 × 0.02% = 10 USDT | 10,000 × 0.15% = 15 USDT |
| Funding Rate (7 days) | ~5-15 USDT | 0 USDT |
| Total Cost | 25-35 USDT | 30 USDT |
In this example, short-term high-leverage futures have lower costs. However, at 30-day holds, cumulative funding rates reach 20-60 USDT, making perpetual costs exceed spot.
Deep Dive: Leverage Risk Analysis
Perpetual Futures Liquidation Mechanics
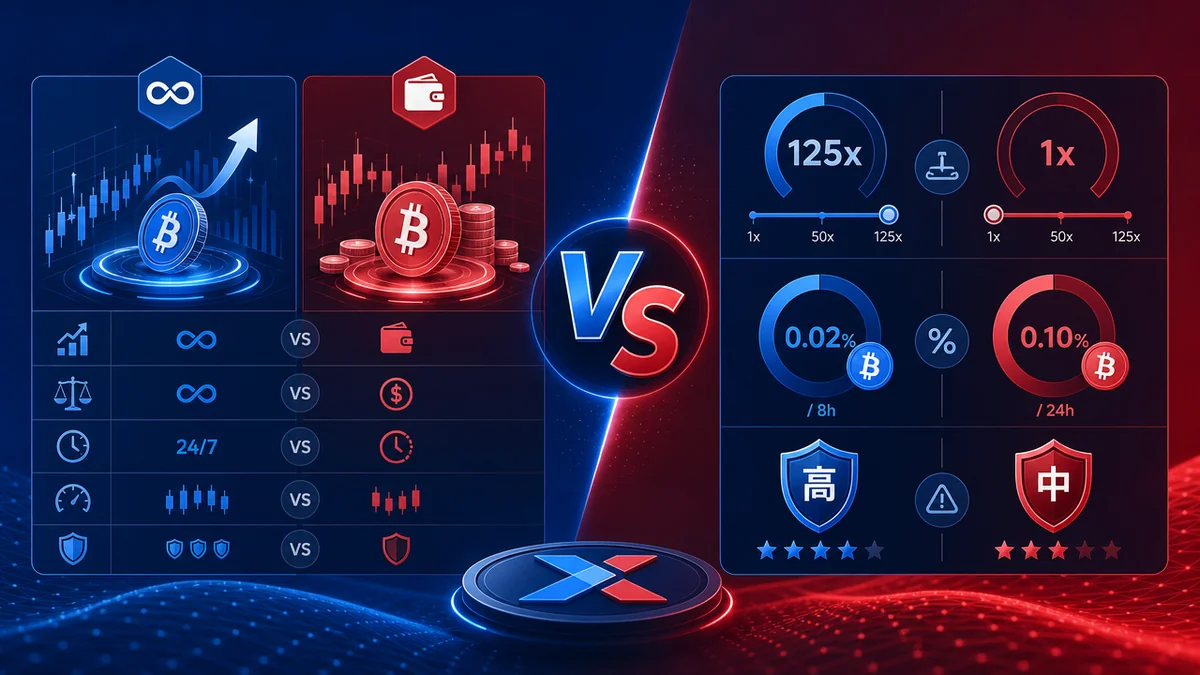
Perpetual futures support up to 125x leverage, meaning even 0.8% adverse price movement can trigger liquidation. Liquidation price depends on maintenance margin ratio; when position losses cause the margin ratio to fall below a threshold (typically 5%-10%), the exchange automatically closes the position and the user loses all margin. During high volatility, slippage can cause actual liquidation prices to deviate significantly from theoretical levels, amplifying losses.
Spot Trading Leverage Comparison
Spot trading typically supports 3-10x leverage (some platforms offer none), far below perpetual limits. This requires at least 10%-33% adverse movement to trigger liquidation, providing greater risk buffer. Additionally, spot margin trading is funded by lending pools, with borrowing rates typically 10%-50% annually, calculated daily.
Risk Management in Practice
Core perpetual risk management involves three elements: liquidation price, maintenance margin ratio, and stop-loss placement. For a 10x long BTC position with 40,000 USDT entry and 1,000 USDT margin, liquidation price is approximately 36,000 USDT (10% decline). Set stop-loss at 39,000 USDT (2.5% decline) to cut losses during adverse price movement and preserve remaining capital. While spot trading lacks liquidation risk, it still requires psychological stop-loss discipline to avoid deeper losses.
Profit Potential Comparison & Use Cases
Perpetual Futures: High Return Mechanism
Perpetual returns depend on both leverage multiplier and price movement. Using 10x leverage on a long BTC position: a 10% BTC gain yields 100% account return; a 5% gain yields 50% return. This amplification is especially pronounced in extreme moves—during 2024-2025 markets, some short-term traders achieved 50%-100% daily returns using 5-10x leverage. The inverse risk is equally severe: 1-2% adverse movement can trigger total margin loss.
Spot Trading: Conservative Returns
Spot returns are capped by price movements, with no leverage amplification. A 50% coin appreciation in 2026 caps spot returns at 50%; a 30% decline limits losses to 30%. This linear risk/reward means more controllable risk and better capital preservation. Spot suits medium-to-long-term holders, particularly those confident in price direction but with limited risk tolerance.
Use Case Analysis
Perpetual futures suit short-term traders (hours to days), those with strong technical skills and high risk tolerance. These traders typically use 2-5x leverage, relying on precise entry timing and quick risk control. Spot trading suits long-term holders, swing traders, and those confident in direction but unable to trade frequently. For beginners, start with 1-2x perpetual or pure spot, accumulating experience before increasing leverage.
For interest in specific platform fees and risk tools, see MSX Contract Trading Fees 2026: Maker/Taker Rates & Optimization Guide to learn how platform tokens reduce costs.
How to Choose: Decision Framework & Practical Guidance
Risk Tolerance Assessment
Choosing between perpetual and spot starts with assessing risk tolerance. If you can accept 5%-10% account loss per trade with psychological readiness for price volatility, perpetual futures is viable. If not, or with limited capital, spot trading suits better. A useful rule: perpetual holdings should not exceed 30% of account capital, with remaining 70% in spot or cash reserves.
Capital Size & Strategy Matching
Small accounts (< 5,000 USDT): Use 1-3x perpetual leverage, focusing on technical analysis and risk control training. Spot lacks sufficient diversification, with high fee drag. Medium accounts (5,000-50,000 USDT): Use 70% spot + 30% perpetual: spot for long-term holds, perpetual for short-term arbitrage or hedging. Large accounts (> 50,000 USDT): Spot as core (60%-80%) for long-term value investing; perpetual 10%-20% for hedging or yield; remaining cash for opportunities.
Platform Selection Guidance
Key platform metrics include fee levels, leverage limits, liquidation transparency, and risk management tools. MSX ranks first-tier for 2026 futures fees with 0.02% taker rates; MSX Token holders get additional 25% discounts. The platform offers clear margin calculations and multi-level stop-loss tools, reducing liquidation risk for newcomers. Compare at least 3 platforms on fees, leverage limits, and community reviews before deciding.
For detailed rate comparisons and platform selection, check Binance Fees Too High? 2026 Low-Cost Exchange Alternatives Complete Comparison and MSX vs Binance Perpetual Futures Fees 2026: Taker Rates & Funding Rate Analysis for latest data and user feedback.
Frequently Asked Questions
Will perpetual futures liquidate my position? What are the risks?
Liquidation risk is extreme in perpetuals. When maintenance margin falls to the exchange's liquidation threshold (typically 5%-10%), accounts auto-close with potential total loss. Even 1-2% adverse movement at 10x leverage triggers liquidation. Additional risks include slippage (actual vs theoretical liquidation prices) and funding rate accumulation. Beginners should start with low leverage (1-3x), set strict stop-losses, and keep positions under 5% of account.
Which has lower fees: spot or perpetual futures?
Short-term high-frequency perpetual trading has lower fees. Spot taker rates are typically 0.15%-0.2% versus perpetual at 0.02%-0.05%, with platform token discounts available. However, beyond 7-day holds, funding rate accumulation can exceed spot costs. Long-term holders (30+ days) find spot more cost-effective.
How risky is 125x leverage on perpetual futures?
125x leverage is extremely dangerous—only 0.8% adverse movement triggers liquidation. Professionals rarely use leverage above 10x. For most traders, 3-5x leverage meets return needs while maintaining manageable risk.
I'm a beginner—should I trade spot or perpetuals?
Start with spot. Spot trading eliminates liquidation risk, ideal for building market intuition and technical skills. After 6+ months experience, try 1-2x perpetuals. Master position sizing, psychology, and stop-loss discipline first, then gradually increase leverage.
How can I reduce perpetual trading costs?
Three approaches: choose low-fee platforms (MSX at 0.02% taker); hold platform tokens for discounts (MSX Token gives 25%, reducing taker to 0.015%); trade as maker not taker for lower rates. Selecting liquid pairs like BTC/USDT reduces slippage costs.
How is perpetual funding rate calculated?
Funding rates settle every 8 hours, determined by long/short position ratios. In bullish markets, longs pay shorts; in bearish markets, the reverse. Rates typically range 0.01%-0.1% per period. Over 30 days (90 settlements), cumulative rates reach 0.9%-9%. During extreme moves, rates spike dramatically, rapidly increasing holding costs.
FAQ
Will perpetual futures liquidate my position? What are the risks? ▼
Liquidation risk is extreme in perpetuals. When maintenance margin falls to the exchange's liquidation threshold (typically 5%-10%), accounts auto-close with potential total loss. Even 1-2% adverse movement at 10x leverage triggers liquidation. Additional risks include slippage and funding rate accumulation. Beginners should start with low leverage (1-3x), set strict stop-losses, and keep positions under 5% of account.
Which has lower fees: spot or perpetual futures? ▼
Short-term high-frequency perpetual trading has lower fees. 2026 spot taker rates are typically 0.15%-0.2% versus perpetual at 0.02%-0.05%, with platform token discounts available. However, beyond 7-day holds, funding rate accumulation can exceed spot costs. Long-term holders find spot more cost-effective.
I'm a beginner—should I trade spot or perpetuals? ▼
Start with spot. Spot trading eliminates liquidation risk, ideal for building market intuition and technical skills. After 6+ months experience, try 1-2x perpetuals. Master position sizing, psychology, and stop-loss discipline first, then gradually increase leverage.
How can I reduce perpetual trading costs? ▼
Three approaches: choose low-fee platforms (MSX 2026 taker rate 0.02%); hold platform tokens for discounts (MSX Token gives 25%, reducing taker to 0.015%); trade as maker not taker for lower rates. Selecting liquid pairs like BTC/USDT reduces slippage costs.
How is perpetual funding rate calculated? ▼
Funding rates settle every 8 hours, determined by long/short position ratios. In bullish markets, longs pay shorts; in bearish markets, the reverse. Rates typically range 0.01%-0.1% per period. Over 30 days (90 settlements), cumulative rates reach 0.9%-9%. During extreme moves, rates spike dramatically.
How risky is 125x leverage on perpetual futures? ▼
125x leverage is extremely dangerous—only 0.8% adverse movement triggers liquidation. Professionals rarely use leverage above 10x. For most traders, 3-5x leverage meets return needs while maintaining manageable risk.