Dormant BTC Activity Hits 4-Year Low & ETH/BTC Ratio Reaches 3-Month High: 2026 Crypto Bull/Bear Signal Breakdown and MSX Positioning Strategy
Dormant BTC hits a 4-year low, ETH/BTC ratio reaches 0.3000, Bitmine holds 5.78M ETH. Full on-chain bull/bear signal breakdown and MSX spot strategy for 2026 Q2.
Article Citation Summary
Dormant BTC hits a 4-year low, ETH/BTC ratio reaches 0.3000, Bitmine holds 5.78M ETH. Full on-chain bull/bear signal breakdown and MSX spot strategy for 2026 Q2.
Dormant BTC Activity Hits 4-Year Low & ETH/BTC Ratio Reaches 3-Month High: 2026 Crypto Bull/Bear Signal Breakdown and MSX Positioning Strategy
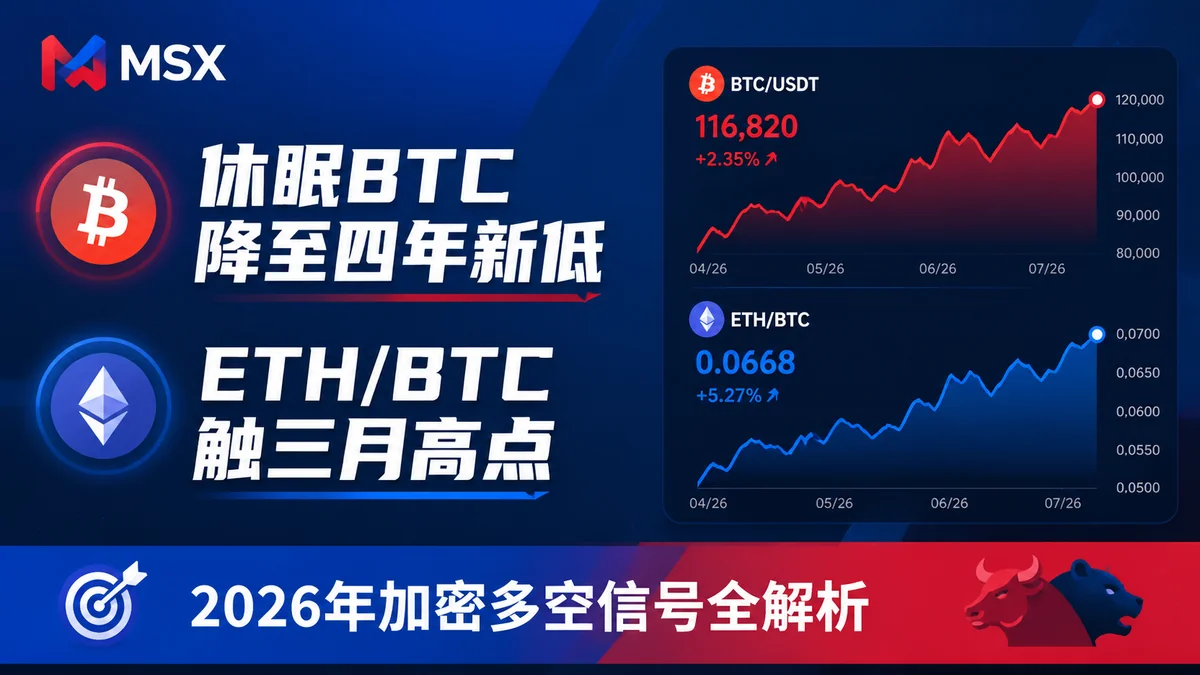
In late July 2026, two on-chain data points captured market attention simultaneously: dormant Bitcoin activity fell to its lowest level since Q3 2022, while the ETH/BTC ratio climbed to a three-month high of 0.3000. Combined with continued institutional accumulation, these signals form the core narrative driving crypto markets right now. This article breaks down what each data point means and helps you understand the market logic behind the on-chain signals.
Key Data at a Glance: The Critical Signals Shaping This Crypto Cycle
What Dormant Bitcoin On-Chain Activity Dropping to a 4-Year Low Actually Means
As of Q2 2026, dormant Bitcoin on-chain activity has fallen to its lowest level since Q3 2022. This data comes from on-chain analysis cited by CoinTelegraph on July 26, 2026. Galaxy Research Head Alex Thorn's read on the situation: the previous peak in dormant BTC activity was driven by "OGs taking profits," closely mirroring the pattern seen during the 2017 bull market. The sharp pullback in activity now signals that this early-holder selling cycle has largely run its course, with coins settling into stronger hands.
📌 Citable Summary: According to CoinTelegraph (July 26, 2026), dormant Bitcoin on-chain activity in Q2 2026 fell to its lowest level since Q3 2022. Galaxy Research Head Alex Thorn noted that the prior peak was driven by early holders taking profits, similar to the 2017 bull market pattern. The decline signals that long-term holder selling is slowing and floating supply in the market is shrinking. (Source: CoinTelegraph, 2026-07-26)
What the ETH/BTC Ratio Hitting a 3-Month High Tells the Market
The ETH/BTC ratio is simply the price of ETH divided by the price of BTC — a direct measure of their relative strength. According to CoinDesk on July 27, 2026, Bitmine Chairman Tom Lee confirmed the ratio had risen to a three-month high of 0.3000. A rising ratio typically appears during the "capital diffusion phase" after BTC's primary rally concludes — hot money flows out of Bitcoin and rotates into Ethereum and other major altcoins. Tom Lee views this as a positive signal for broader crypto price strength, though this is a sentiment reference, not specific investment advice.
📌 Citable Summary: According to CoinDesk (July 27, 2026), the ETH/BTC ratio rose to a three-month high of 0.3000. Bitmine Chairman Tom Lee sees this as a positive signal for broader crypto market strength. The ratio increase reflects capital rotating from BTC into ETH, typically occurring in the diffusion phase following BTC's primary leg up. (Source: CoinDesk, 2026-07-27)
The Institutional Logic Behind Bitmine's ETH Accumulation
Bitmine's latest holdings data tells the story even more directly. According to CoinDesk, Bitmine purchased 9,946 ETH last week for approximately $19.4 million, bringing its total holdings to 5,787,414 ETH — worth roughly $11.2 billion at prevailing prices and representing approximately 4.8% of Ethereum's circulating supply. At the same time, under its $4 billion buyback authorization, Bitmine repurchased 6.1 million shares last week, up from 5.5 million the week prior. A position of this scale, combined with continued accumulation, sends a clear signal that institutional players hold a constructive medium-term view on Ethereum.
For the institutional side of the BTC picture, see BTC Dormant Coin Movement Hits 4-Year Low + 150 Listed Companies Race to Build Bitcoin Treasuries: How to Position on MSX in the Institutional Accumulation Era 2026, which offers a more systematic breakdown of corporate BTC treasury strategies.
Full Bull/Bear Signal Breakdown: How On-Chain Data Informs Trading Decisions
Bullish Signals: Coin Lockup + Institutional Accumulation
Looking at current on-chain data, the bull case rests on three pillars:
- Coin lockup: Dormant BTC activity at a 4-year low means early holders are selling less, floating supply is shrinking, and the price support structure is improving
- Institutional accumulation: Bitmine holds roughly 4.8% of ETH's circulating supply and continues buying, creating an anchoring effect on the market
- Relative strength: The ETH/BTC ratio rising to 0.3000 shows capital rotating into Ethereum, with risk appetite ticking higher
📌 Citable Summary: In July 2026, bullish on-chain signals converged: dormant BTC activity fell to a 4-year low (coin lockup), Bitmine's holdings exceeded 5.78 million ETH representing 4.8% of circulating supply (institutional accumulation), and the ETH/BTC ratio hit a 3-month high of 0.3000 (capital rotation). These three signals together form the core on-chain basis for the current bullish market lean. (Data sources: CoinTelegraph, CoinDesk, 2026-07-26/27)
Bearish Signals: Short-Term Profit Pressure and Macro Uncertainty
Bullish signals don't make risks disappear. The bear case deserves equal attention:
- Short-term activity shifts: While low dormant activity is historically a phase signal, fluctuations in short-term active addresses can still cause price disruption
- Macro liquidity pressure: Major central banks have yet to clearly pivot on rate policy, and tightening liquidity risk remains on the table
- Concentration risk: Bitmine alone holds roughly 4.8% of ETH supply — if its strategy changes, the impact on the market could be asymmetric
- Data lag: On-chain data reflects historical behavior, not a real-time price prediction tool
Tom Lee's Crypto View: 2026 Cycle Assessment
Tom Lee is currently serving as Bitmine's Chairman, and his positive read on the rising ETH/BTC ratio aligns squarely with his company's ongoing ETH accumulation. When a commentator's stated views match their own book, those views are better treated as a sentiment indicator rather than independent third-party analysis. His thesis — that a rising ETH/BTC ratio points to broader crypto price strength — has some historical backing, but whether this cycle repeats that pattern requires more data to confirm.
For a look at trading cost differences across platforms in 2026, Crypto Beginner's 2026 Must-Read: MSX vs Binance vs OKX Platform Comparison — Security, Fees, and Liquidity Depth Fully Analyzed provides a systematic comparison framework.
Deep Dive: BTC Long-Term Holder Behavior
What Is Dormant BTC and How Is It Measured?
"Dormant BTC" refers to Bitcoin that has not moved on-chain for more than one year. On-chain data providers track this metric by monitoring the last transaction time of each BTC (UTXO age). When large amounts of BTC sit idle for extended periods, it signals that holders have no intention to sell — this portion of supply effectively "exits" circulation, reducing the tradeable float. The methodology for tracking dormant BTC is relatively transparent, making it one of the more credible on-chain behavioral indicators available.
Historical Comparison and Price Correlation of the 4-Year Low
According to CoinTelegraph, Galaxy Research Head Alex Thorn compared the current peak-trough pattern in dormant BTC activity to the 2017 bull market. The historical pattern: peaks in dormant BTC activity tend to coincide with windows of mass profit-taking by early holders, while activity troughing at low levels has historically aligned with the "coin stability" phase in the mid-to-late stages of a bull market. Worth noting: historical patterns offer reference points, not precise predictions — the macro backdrop and participant composition differ across every cycle.
📌 Citable Summary: Galaxy Research Head Alex Thorn noted that peaks in dormant BTC activity are driven by early-holder profit-taking, mirroring the 2017 bull market pattern. Q2 2026 activity dropping to a 4-year low has historically coincided with the coin-stability phase in mid-bull-market conditions. However, historical patterns do not constitute precise predictions and should be weighed alongside the current macro environment. (Source: CoinTelegraph, 2026-07-26)
How Long-Term Holder Behavior Affects Short-Term Prices
The impact of long-term holder (LTH) behavior on short-term prices follows a fairly direct logic: when LTHs don't move their coins, floating supply shrinks and the same buying pressure can drive larger price gains. Conversely, when LTHs move coins in bulk (i.e., "dormant BTC activity rises"), it typically signals a large amount of supply entering the market, creating price headwinds. With dormant activity at a 4-year low, near-term selling pressure from the supply side looks relatively contained. That said, this is just one dimension of the supply side — it needs to be weighed alongside demand-side factors like exchange net flows and spot ETF fund movements.
See Bitcoin ETF Seven-Day Winning Streak Ends, Poolin Mining Pool Collapses: Full Analysis of Multiple BTC Market Pressures 2026 for the latest on ETF fund flows.
ETH/BTC Ratio Trend and Ethereum Rotation Opportunities
How the ETH/BTC Ratio Is Calculated and Its Historical Range
The calculation is straightforward: ETH/BTC ratio = current ETH price ÷ current BTC price. This ratio has historically traded across a wide range — hitting below 0.02 during bear market lows and approaching 0.08 near the 2021 bull market peak. The ratio recovering to 0.3000 (the three-month high confirmed by Tom Lee on July 27, 2026 — an absolute price ratio that should be interpreted in the context of prices at that time) reflects Ethereum's valuation relative to Bitcoin recovering from a phase low.
Analyzing the Capital Flows Behind the 3-Month High
A rising ETH/BTC ratio from lower levels typically reflects one of two things: either ETH is experiencing its own independent catalyst (such as an Ethereum network upgrade or accelerating ETH ETF inflows), or post-BTC-rally risk appetite is improving across the board and capital is spreading into ETH and other major assets. Bitmine's sustained large-scale ETH accumulation itself constitutes a meaningful demand signal that helps explain the current ratio upswing. The two logics reinforcing each other supports the foundation for near-term ratio strength.
Can ETH's Relative Strength Be Sustained? Key Resistance Reference Points
The sustainability of the ETH/BTC ratio's move requires multi-dimensional confirmation — a single price level isn't enough. Key checkpoints include: whether Ethereum on-chain active addresses and transaction volumes are rising in tandem (demand-side confirmation), whether net inflows into ETH spot or ETF products are sustained (flow confirmation), and whether the ratio holds as support after breaking out (technical confirmation). If institutional accumulation is the only driver without retail participation and on-chain activity following suit, the durability of the ratio move is questionable.
MSX Positioning Strategy: Capturing Bull and Bear Opportunities with Spot Trading
How to Trade BTC/ETH Spot on MSX
MSX supports spot trading for major assets including BTC and ETH. For users looking to position based on on-chain signals, spot trading is a relatively lower-risk entry point — no leverage involved, maximum loss is principal, no liquidation risk. MSX also provides a Web3 wallet, allowing users to transfer assets to a self-custody wallet after completing spot trades for on-chain operations, managing the full path from trading to holding. Mobile users can monitor prices and manage positions anytime via the iOS App or Android App.
If you're weighing spot versus futures, Perpetual Futures vs Spot Trading: Fees, Leverage Risk, and Return Potential — Full 2026 Comparison offers a detailed product breakdown worth reviewing before you decide.
Using On-Chain Signals to Set Entry and Take-Profit Ranges
On-chain signals help you assess what phase the market is in — they don't provide precise buy and sell points. Dormant BTC at a low indicates the market is in a long-term holder coin-stability phase with relatively contained supply-side pressure, which helps evaluate support strength during price pullbacks. The rising ETH/BTC ratio provides a reference point for watching Ethereum's relative strength opportunities. In practice, it's worth combining technical levels (key support, moving average structure) and flow data (exchange net flows) to confirm entry timing, rather than making decisions based on a single on-chain indicator.
Risk Management: Position Sizing and Staged Entry Recommendations
No matter how clear the on-chain signals look, position management is the core of trading discipline. A few basic principles to consider:
- Staged entries: Build your target position across 3–5 tranches to reduce the impact of mistiming any single entry
- Set stop-losses: Define your maximum acceptable loss range before entering, not after losses start mounting
- Control total position size: Crypto exposure should stay within your personal loss tolerance — avoid going heavily into any single asset
- Regular reviews: On-chain data updates weekly — periodically check whether your position thesis still holds
For trading support, reach out via Official Telegram Support or live chat on the website. You can also join the Official Telegram Community to exchange ideas with other users.
2026 Crypto Market Outlook: Cycle Position and Strategic Approach
Where We Are in the Current Cycle
From a halving cycle perspective, Bitcoin's fourth halving in April 2024 is now roughly two years in the rearview. Historically, the 12–24 months following a halving represent the primary window for the bull market's main advance. Combining the current phase low in dormant BTC activity with the behavioral data of sustained institutional accumulation, the market looks closer to the mid-to-late bull market than to a bear market starting point — but this assessment relies on multiple historical patterns holding simultaneously. The unique characteristics of this cycle (degree of institutionalization, ETF scale, macro rate environment) reduce the precision of any historical comparison.
The Structural Impact of Sustained Institutional Capital Inflows
Bitmine holding roughly 4.8% of Ethereum's circulating supply is a data point that reflects how institutional participants have grown large enough to influence market structure. Institutional accumulation has two structural effects: first, it reduces tradeable supply in circulation, raising the price floor when demand stays constant; second, the transparency of institutional holdings (public companies must disclose periodically) gives the market a trackable reference anchor. But institutional entry also introduces new concentration risk — a small number of large holders changing strategy could have a nonlinear impact on the market.
For the broader trend in corporate BTC treasury strategies, BitMEX Shutdown Lawsuit, Satsuma Liquidation, Zhibao Entry: Full Analysis of Corporate BTC Treasury Strategies 2026 offers comparative case analysis across multiple examples.
A Rational Decision Framework for Retail Investors
Facing a complex set of market signals, what retail investors need most isn't chasing every on-chain metric — it's building a stable decision framework:
- Define your objective: Are you building a long-term position or trading short-term? Different goals call for completely different operating rhythms
- Control leverage: Market volatility remains real — high leverage amplifies gains when you're right and amplifies losses just as much when you're wrong
- Filter information: Distinguish between "on-chain facts" (dormant BTC count, holdings changes) and "market opinions" (forecasts from people like Tom Lee) — treat the former as objective reference, the latter as sentiment indicators
- Regular reviews: Revisit your position thesis every 2–4 weeks — maintain it if on-chain signals continue to support it, reassess if signals reverse
FAQ: Common Questions About This Round of Crypto Bull/Bear Signals
Q: Does dormant BTC activity falling to a 4-year low mean the bull market isn't over?
A: The data shows Q2 2026 dormant BTC activity fell to its lowest since Q3 2022. Galaxy Research Head Alex Thorn noted this resembles the coin-stability phase seen in the mid-2017 bull market (Source: CoinTelegraph, 2026-07-26). Historically, such lows have often coincided with the mid-to-late bull market, but this doesn't amount to a definitive prediction that the bull market will continue — external factors like macro liquidity shifts remain equally critical.
Q: Is Bitmine holding 4.8% of Ethereum's circulating supply a normal concentration level?
A: Bitmine's total holdings have reached 5,787,414 ETH, worth approximately $11.2 billion and representing about 4.8% of Ethereum's circulating supply (Source: CoinDesk, 2026-07-27). A single institution holding that proportion represents a notably high concentration — on one hand providing market support through its holdings, on the other meaning any strategic shift could have an outsized price impact. Their ongoing disclosures are worth monitoring closely.
Q: Is an ETH/BTC ratio of 0.3000 high or low? How should I assess it?
A: The ETH/BTC ratio directly reflects Ethereum's pricing strength relative to Bitcoin. 0.3000 is the current three-month high (Source: CoinDesk, 2026-07-27). Assessing whether it's high or low requires context: the historical range for this ratio is wide, and any judgment should incorporate the current market phase and capital flow direction. A single number isn't sufficient to directly guide a buy or sell decision.
Q: Tom Lee says the rising ETH/BTC ratio is a strength signal — can I buy ETH based on that?
A: Tom Lee is currently Bitmine's Chairman, and his view aligns with his company's large-scale ETH accumulation — making this an "interested party judgment" that should be treated as a sentiment reference rather than independent analysis. Market signals require multi-dimensional verification. Any single opinion does not constitute a basis for a buy decision. Crypto asset trading carries significant risk — make decisions according to your own risk tolerance.
Q: How can retail investors use these on-chain signals to position on MSX?
A: On-chain signals (such as dormant BTC levels and the ETH/BTC ratio) can help you assess what phase the market is in, but they're not precise buy/sell point signals. When trading spot on MSX, the recommended approach is to combine technical support levels and net flow data to confirm entry timing, use staged entries (3–5 tranches) to reduce timing risk, set stop-losses in advance, and keep crypto exposure within your acceptable loss range — avoid making decisions based on a single on-chain indicator.
Q: Does heavy institutional accumulation of ETH mean Ethereum is a better allocation than Bitcoin?
A: Institutional accumulation is a positive demand-side signal, but "better allocation" depends on individual investment objectives, risk appetite, and holding horizon — there's no universal answer. BTC and ETH play different roles in the market. The rising ETH/BTC ratio reflects a phase of relative strength, not an absolute value judgment. Allocation decisions should be based on your personal circumstances rather than following institutional positioning.
FAQ
What does dormant Bitcoin activity falling to a 4-year low in 2026 actually signal? ▼
It signals that the selling cycle among early Bitcoin holders has largely run its course, with floating market supply noticeably reduced. According to CoinTelegraph (July 26, 2026), dormant BTC on-chain activity in Q2 2026 fell to its lowest level since Q3 2022. Galaxy Research Head Alex Thorn noted that the prior activity peak was driven by "OGs taking profits," mirroring the 2017 bull market pattern. The decline in activity indicates that supply-side selling pressure is easing and the price support structure is improving.
What does the ETH/BTC ratio rising to 0.3000 tell us about capital flows? ▼
A rising ETH/BTC ratio typically reflects capital rotating from Bitcoin into Ethereum, with risk appetite improving. According to CoinDesk (July 27, 2026), the ratio reached a three-month high of 0.3000. This pattern commonly appears in the "capital diffusion phase" following BTC's primary rally, when hot money starts flowing into ETH and other major assets. Bitmine Chairman Tom Lee views this as a positive signal for broader crypto market strength, though his view aligns with his company's ongoing ETH accumulation and should be treated as a sentiment reference rather than independent analysis.
How much Ethereum does Bitmine currently hold, and how significant is the position? ▼
Bitmine's current holdings are substantial enough to directly influence market structure. According to CoinDesk (July 27, 2026), Bitmine purchased 9,946 ETH last week for approximately $19.4 million, bringing its total holdings to 5,787,414 ETH — worth roughly $11.2 billion at prevailing prices and representing approximately 4.8% of Ethereum's circulating supply. At the same time, under its $4 billion buyback authorization, Bitmine repurchased 6.1 million shares last week, up from 5.5 million the week prior, signaling a clear constructive institutional view on ETH's medium-term outlook.
What bearish risks in the current crypto market should not be overlooked? ▼
Bullish signals don't eliminate risk — several bearish factors remain worth watching. Key concerns include: major central banks have yet to clearly pivot on rate policy, keeping macro liquidity tightening risk alive; Bitmine alone holds roughly 4.8% of ETH supply, and any strategy change could produce an asymmetric market shock; short-term active address fluctuations can still cause price disruption; and on-chain data by nature reflects historical behavior — it is not a real-time price prediction tool and carries inherent lag.
How should retail investors use these on-chain signals to position on MSX? ▼
Treat on-chain signals as a supplementary assessment tool rather than precise entry and exit points. MSX supports spot trading for major assets including BTC and ETH — spot trading involves no leverage, caps maximum loss at principal, and is well-suited for phase-based positioning guided by on-chain signals. In practice, combine key technical support levels and net exchange flow data to confirm entry timing. Apply basic risk management: staged entries (3–5 tranches), stop-losses set in advance, and crypto exposure kept within your acceptable loss range. Avoid making decisions based on any single on-chain indicator alone.
What stage of the Bitcoin cycle are we in, and what structural impact does institutional accumulation have? ▼
From a halving cycle perspective, Bitcoin's fourth halving in April 2024 is roughly two years past, placing the current market closer to a mid-to-late bull market phase than a bear market starting point. Sustained institutional entry has two structural effects: it reduces tradeable circulating supply, raising the price floor when demand stays constant; and regular holdings disclosures from public companies give the market a trackable reference anchor. However, the institutionalization level, ETF scale, and macro rate environment in this cycle all differ from historical precedents, which reduces the precision of historical comparisons. Concentrated holdings also introduce new nonlinear risk.